Mining the Yield Curve in Times of Contracting Loan Spreads
last updated on Monday, July 18, 2022 in Strategies
“Buy the Bond” or “Book the Loan?”
The implied forward yield curve serves as a good picture of the so-called “point spread,” or what borrowers and investors are collectively projecting for interest rates at a given point in time. What does the implied forward curve currently suggest? Our review of a recent implied yield curve shows that, throughout the yield curve, from an investor’s perspective, there appears to be an advantage of funding very short and investing particularly in the 12-24-month sector, and perhaps the longer-end of the curve. Why invest at all? Reports from the field still describe a lending market that remains competitive and spread-sensitive. In the face of disappointing spreads, yet attempting not to overly generalize, it may be a time to “buy the bond” as opposed to “booking the loan.” Once credit spreads and origination costs are considered, it’s occasionally prudent to achieve balance sheet growth via a range of investments that could, as an example, run the range of: treasuries, agencies, 20-year muni’s with 10-year lockouts, or perhaps even FNMA Debt Underwritten Security (“DUS”) bonds which are supported by multifamily loan pools.
What is the Implied Forward Yield Curve Telegraphing?
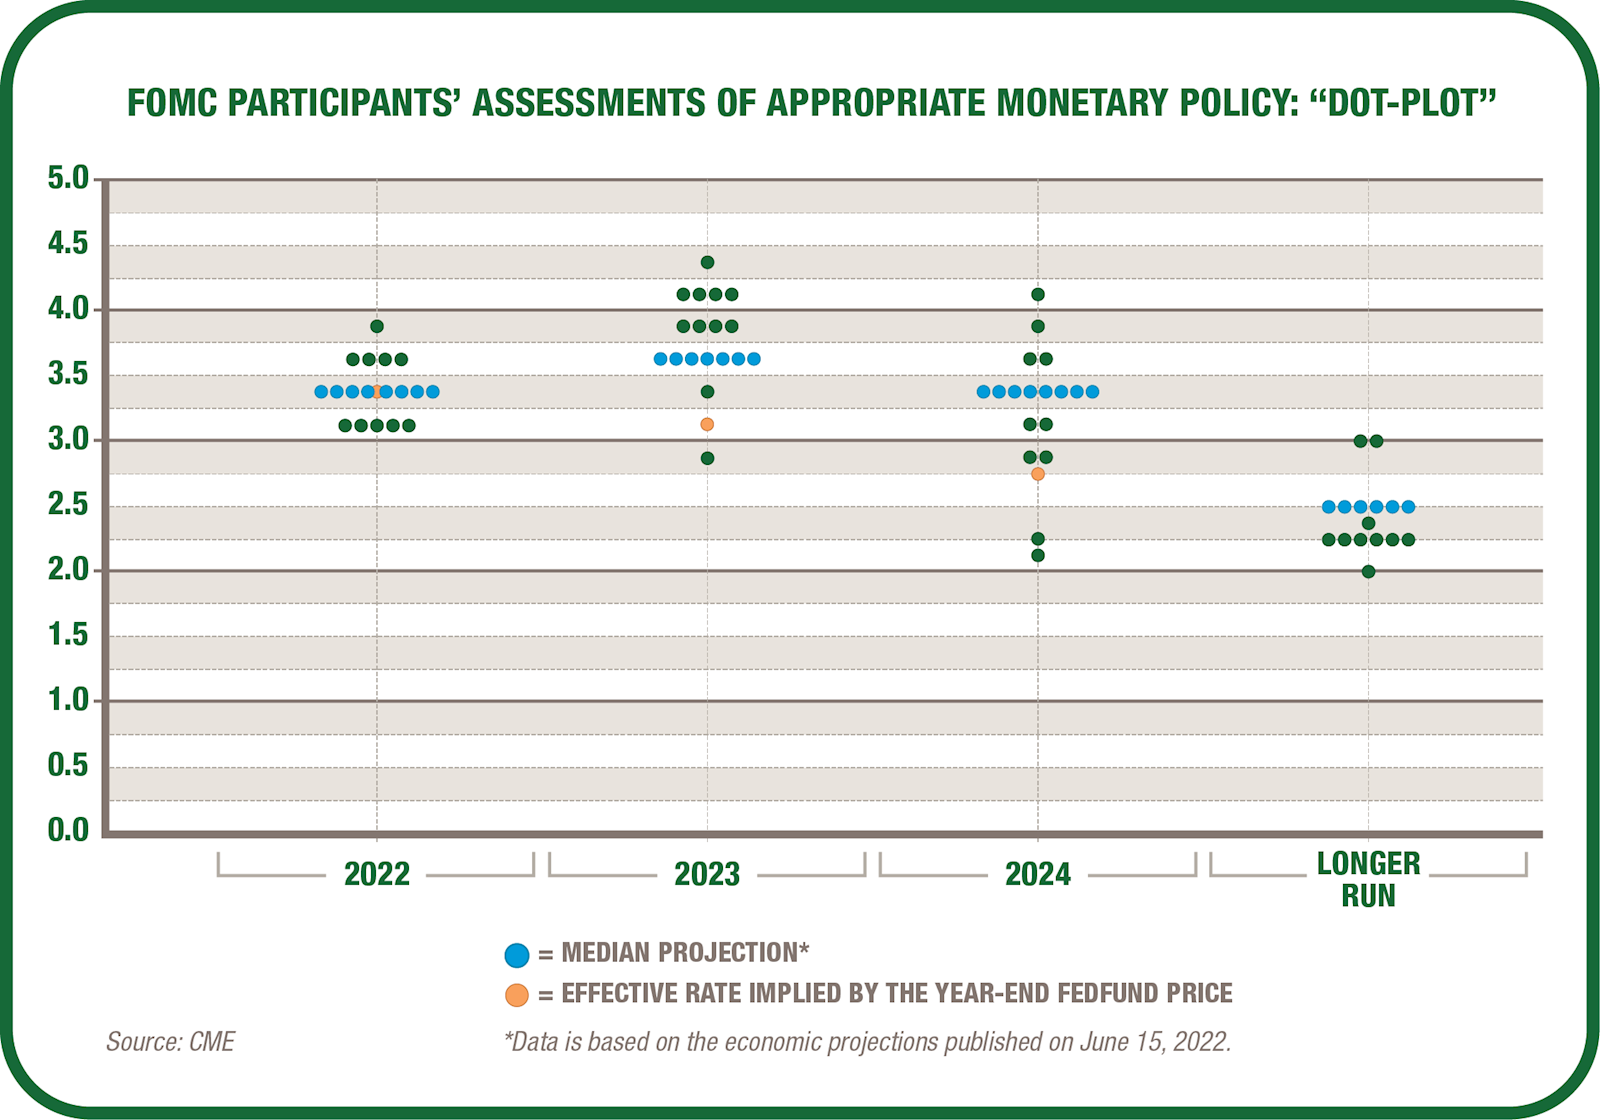
For a moment, consider the implied forward yield curve, or for that matter, the yield curve itself. As represented by the Federal Open Market Committee’s assessment of future monetary policy (Figure 1), the Fed has telegraphed continued tightening of short-term rates well into 2023. Post-2024, the yield curve currently resembles a “yield line” and remains relatively flat. On the longer end of the yield curve, focus remains on the reversal of the Fed’s quantitative easing as represented by the more-than-doubling of its balance sheet since the onset of the pandemic. In January of 2020, the ratio of the Fed’s balance sheet to nominal GDP stood at 22%, whereas at the end of May that ratio stood at 36%. Starting in June of 2022, the Fed plans to reduce the balance sheet by no longer reinvesting proceeds of $47.5 billion in maturing Treasury, agency and mortgage-backed securities per month. In September of 2022, the cap for combined monthly balance sheet roll-off of $95 billion (or a reduction of $1.14 trillion per year). So, a question many a balance sheet manager will be asking: “Will a 12% per annum reduction in the Fed’s balance sheet be enough to flatten the yield curve?”
FOMC “Dot Plot”
Total Assets of the Federal Reserve: June 30, 2007 – June 15, 2022

A further word on the concept of the implied forward yield curve. As an example, consider the case of an investor that is thinking about investing in a one-year fixed income security versus a two-year security, per Figure 3. We’ll ask the question, “At what point would you be better off purchasing the two-year security and selling it at the end of the first year, versus purchasing a one-year security?” That is, should rates rise, even though some principal loss could occur with the longer-duration security, would the extra yield earned on that security more than offset the loss? A break-even analysis model suggests that the answer is ‘no’. Of late, there’s only been roughly one basis point of protection from rising rates in this range. An investor would have only made the right decision to invest in the two-year security if rates wouldn’t rise by more than one basis point during the one-year period. In and of itself, that’s not a real good reason to invest long. Conversely, for borrowers, the implied forward yield curve analysis, again, all other considerations aside, would suggest funding with shorter durations. Again, we’re looking at simply the yield curve’s so-called “point spread” and your own institution’s unique balance sheet rate sensitivity should remain an important consideration. While not the “be-all-end-all,” implied forward rates are gauges that you should keep an eye over as a tool to help you do what’s right for your own balance sheet.
Keeping in mind that i) pockets of the yield curve provide more levels of “break-even pick-up” and ii) the fact that the majority of depositories are currently asset-sensitive and would see their interest margins decline should rates also decline; it’s useful to analyze the impact of using short-term advance funding upon various investment scenarios. Don’t blink, but today’s implied forward curve projects investment optimality at one-year. Beyond that, implied forward rates don’t reflect investment advantage until beyond five-year maturities.
FHLB Des Moines Yield Curve “Optimal Points Analysis"

Perhaps, trends in the implied forward yield curve explain a portion of why FHLB Des Moines has recently seen an uptick in member advance activity in the form of rolling short-maturity bullets, with proceeds being invested either in the shorter-term sector, or in “barbell” investments.
Investing and Funding at Optimal Points
We tested several blended funding strategies that simulate investment returns associated with two interest rate scenarios over a three-year horizon: i) flat rate conditions, and ii) a situation that emulates Figure One’s FOMC “dot plot” scenario in which rates continue to rise through the balance of 2022 and then taper downwards in the third year.
On the funding side, we assumed that, at the outset, one-half of proceeds were derived from rolling a combination of overnight, one-week and two-week advances; with the other half derived from rolling deposit funding. Over the time horizon, we further assumed that a portion of the advance funding would be paid off when investment securities matured.
On the investing side, we assumed that funding proceeds were directed into either: a) exclusively-two-year agencies, or b) a “barbell” strategy that included a mix of two-year Agencies, seven-year FNMA DUS bonds and 20-year municipal bonds with ten-year call protection.
As depicted in Figure 4 through Figure 7, results of each of the four scenarios showed generated weighted average lifetime spreads ranging between 1.87% (FOMC “Dot Plot” scenario and two-year-maturity investments) and 2.77% (flat rate scenario and a “barbell” investment strategy).
Assuming that you subscribe to the principle that your institution cannot shrink its way toward optimizing shareholder value; in spite of contracting loan spreads, it may be worth considering the yield curve’s dynamics and fund/invest accordingly. As many institutions remain asset-sensitive, it may be prudent to blend your deposits with duration-certain short-term advances and invest those proceeds in the most advantageous points of the yield curve.
Your FHLB Des Moines Relationship Manager can help you grow your balance sheet, and assist in evaluating different funding and investing strategies that can mine the optimal points of the yield curve, even during times of suboptimal loan spreads.
Blended Funding - Flat Rates: “Barbell” Investments (Two-Year Agencies, FNMA DUS Bonds, 20-Year Muni w/ 10-Year Call Protection)

Blended Funding – FOMC Scenario: Investment in Two-Year Agencies

Blended Funding – Flat Rates: Investment in Two-Year Agencies

Blended Funding – FOMC Scenario: “Barbell” Investments (Two-Year Agencies, FNMA DUS Bonds, 20-Year Muni w/ 10-Year Call Protection)
